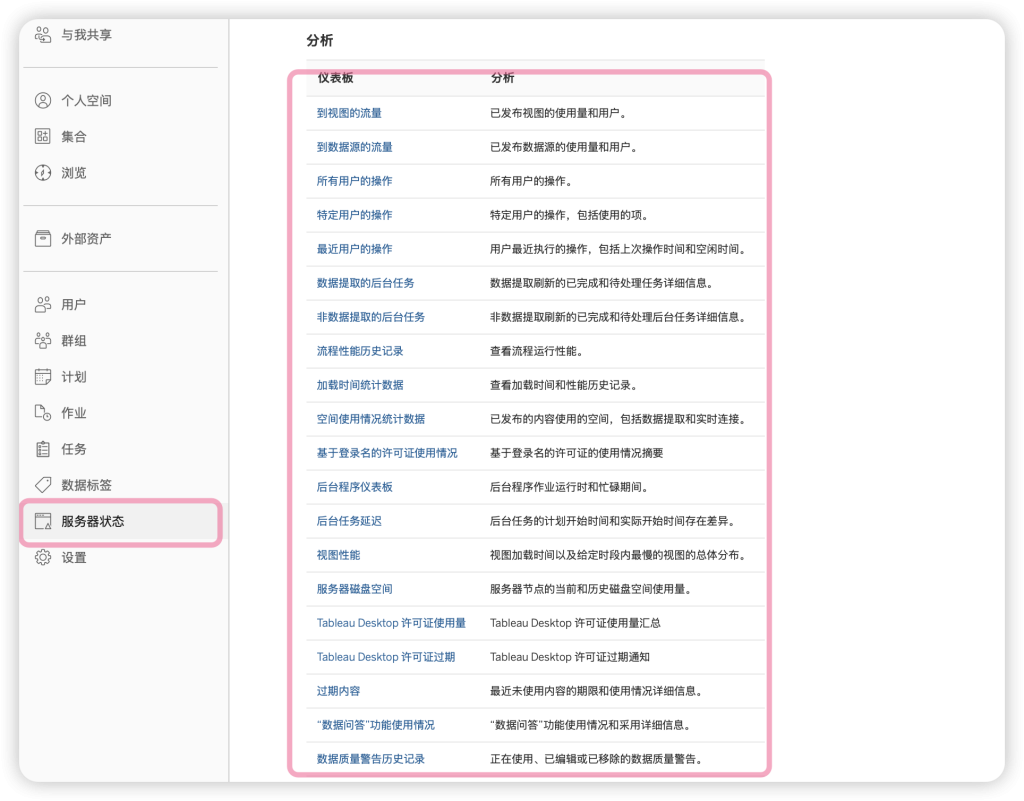
在 Tableau server 中,系统默认内置了多个管理视图,包括视图性能、提取性能、磁盘空间等多个主题。
近期,喜乐君为某外资客户提供了“Tableau Server 服务器运维服务”,为之诊断提取时间漫长、资源不足等问题。
- 每天凌晨到上午10点,几百个任务先后执行,延误了一早的视图有效性
- 服务器资源受限,不确定是扩展服务器节点,还是增加 CPU 资源
期初,我准备使用系统默认的视图,比如上面的“数据提取的后台任务”,如下所示:
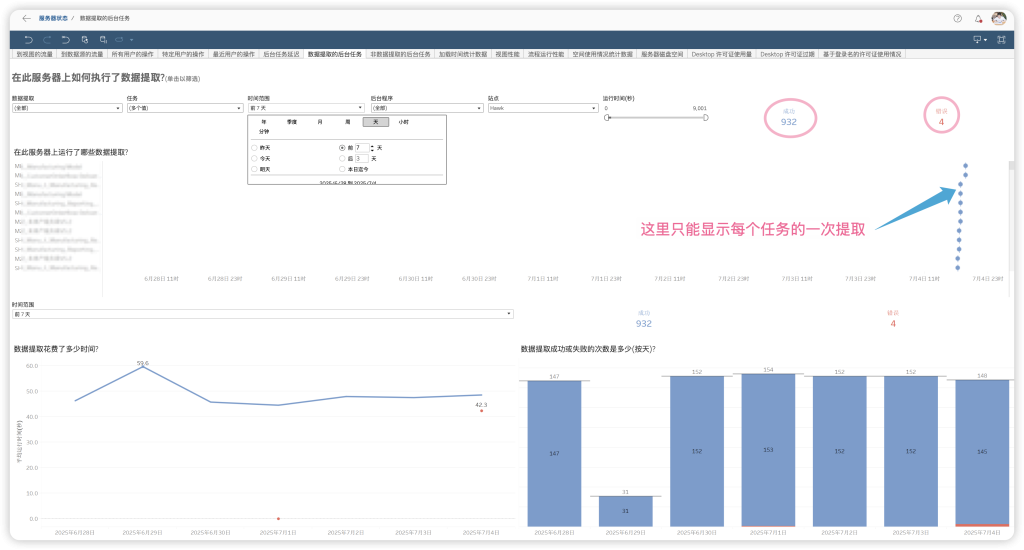
官方视图内容翔实,但如果我要检查一周甚至一个月的数据提取,那么上面就会出现很长的滚动条,我很难检查每个提取的频次、时长等关键信息。
为此,聪明的服务器管理员可以连接 Tableau Server 的内置存储库Repository,使用其元数据底表完成自定义可视化分析——毕竟手中有 Tableau,还有什么可怕的呢。
自定义数据提取检查视图
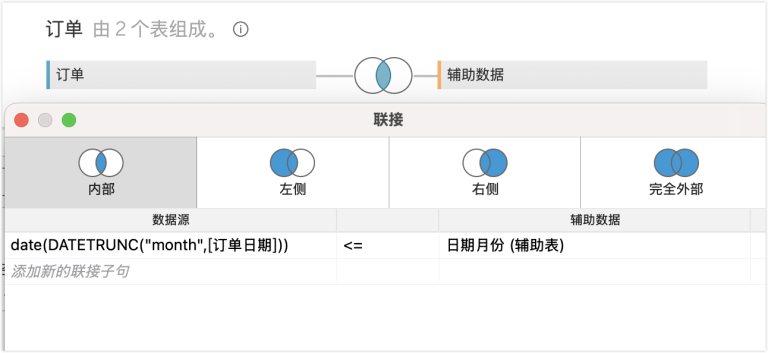
为此,我申请开通了 Tableau Repository 的访问权限,而后连接 Postgresql 数据库,使用如下数据表完成分析:
_background_task 数据表:该视图包含后台任务和系统任务的关键信息。
This view combines the important contents of both the background_jobs table and the async_jobs table to give an overall picture of jobs that were given to a backgrounder process.
该数据表的元数据如下所示:
| public._background_tasks: | ||
|---|---|---|
| Name | Type | Description |
| backgrounder_id | character varying | The id of the backgrounder process that did the work. |
| id | integer | The primary key of either the background_jobs record or the async_jobs record, depending on where this record is coming from. |
| created_at | timestamp without time zone | When this record was created. |
| completed_at | timestamp without time zone | When the job finished execution. When set, this should generally agree with the updated_at field. |
| finish_code | integer | Completion status for the job. Will be 0 for success, 1 for failure, and 2 for cancelled. |
| job_type | character varying | The type of job being run. This looks a bit odd because it comes from a serialized symbol. |
| progress | integer | Can be used to indicate percent complete for the job, but in most cases simply gets set to 100 when the job is completed. |
| args | text | Used as a means of passing parameters about the background job. This information is stored in a special serialized format, and thus is not easily readable. |
| notes | text | Can be used to store additional information about the running of the job. |
| started_at | timestamp without time zone | When the execution of the job was started. This is not generally the same as created_at, because it may take some time before a backgrounder “notices” the newly created record and begins to process it. |
| job_name | character varying | A nice readable name for this type of job. |
| priority | integer | Controls which background_jobs records are processed first. The highest priority is 0, and the lowest is 100. Integer values in between are also valid. |
| title | character varying | Can be used to provide some additional information about the job. |
| processed_on_worker | character varying | Identifies the machine on which the job is run. |
| subtitle | character varying | Can be used to provide some additional information about the job. |
| language | character varying | The language for the job is listed here. |
| site_id | integer | Links to a site, if one is relevant, otherwise it is left NULL. |
| locale | character varying | The locale for the job is listed here. |
| subscriptions_attach_image | boolean | Boolean that represents whether to attach images to a subscription background_job. Will be NULL if the background_job is not a subscription. |
| subscriptions_attach_pdf | boolean | Boolean that represents whether to attach a PDF to a subscription background_job. Will be NULL if the background_job is not a subscription. |
于是,我使用上述数据表构建了一个管理视图仪表板,如下所示:
使用客户数据构建,不含敏感信息;该客户所有分析均为喜乐君公司提供。
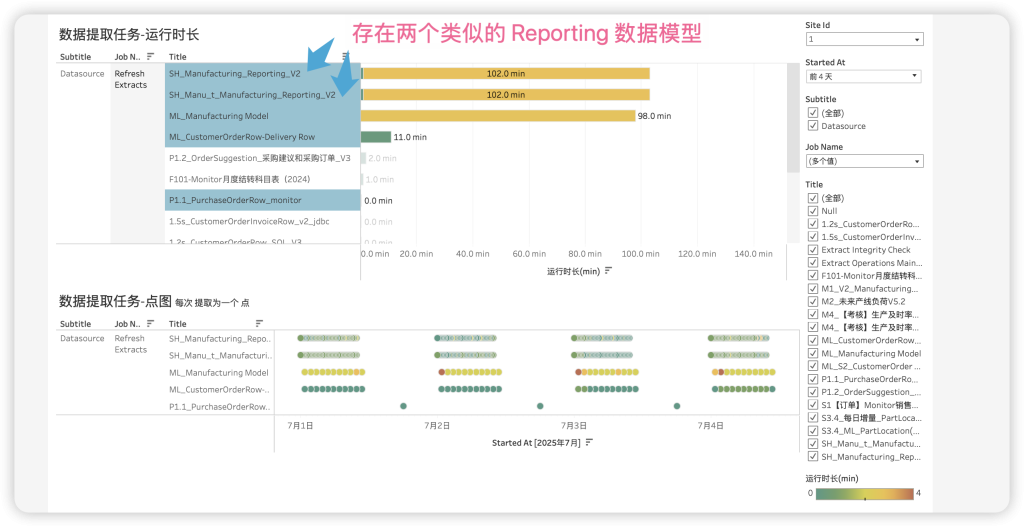
从上面可以看出,这里存在两个 Reporting_v2的数据模型,而且提取频率完全一致(每隔15分钟增量刷新),过去4天,每个数据累计提取时长102分钟,每次不足1分钟。
这样,我就能发现数据源存在的同质化问题,问题出在新数据源在不同位置发布了两遍,而我之前没有意识到!
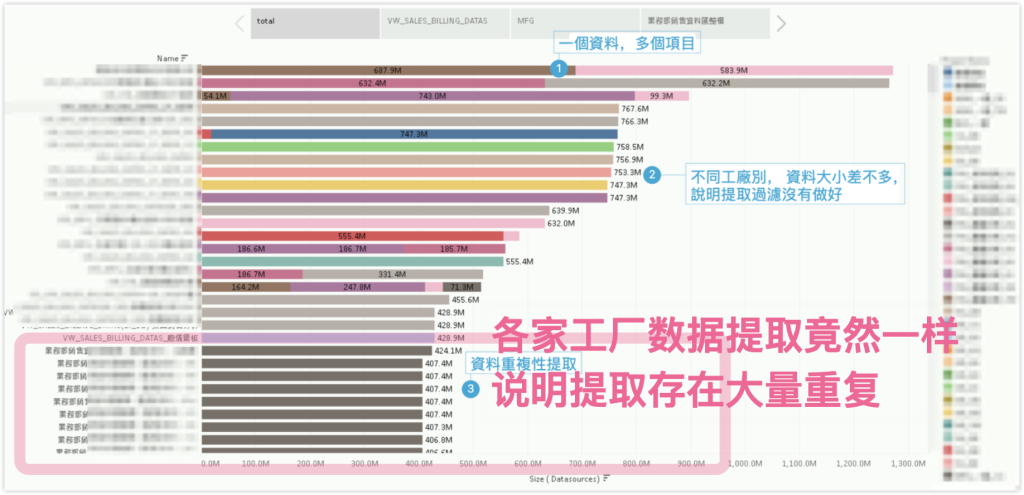
另一家客户也是一样,但问题更加严重。同一份数据源在各个工厂中都有提取,本意是加强数据权限控制,但结果数据源大小竟然几乎一样,这就说明大量的提取消耗在了重复性提取上。如下图所示:
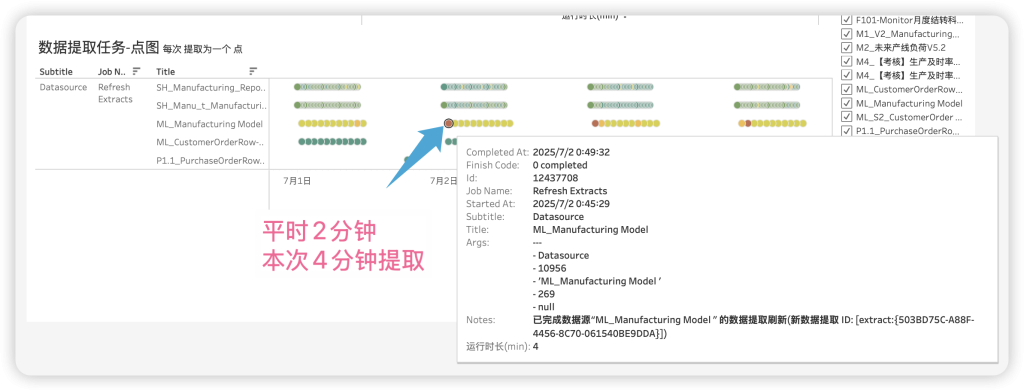
这种仪表板相比官方仪表板更适合长周期的检查分析,通过交互可以发现异常,也可以表示更多细节。
比如我发现有一个提取比平时要久一些(颜色更深),所以我可以鼠标悬停查看细节,发现平时只需要2分钟的提取,这次消耗了4分钟;好在最后成功完成;如果频繁出现这种情况,说明资源占用比较严重。如下所示:
是不是非常优雅。
优化数据提取的最强技能:全量刷新和增量刷新结合
如果一个数据每次提取时间超过二十分钟、不追求当日 T+0数据、历史数据更新不频繁,我就建议使用增量和全量相结合的方式。
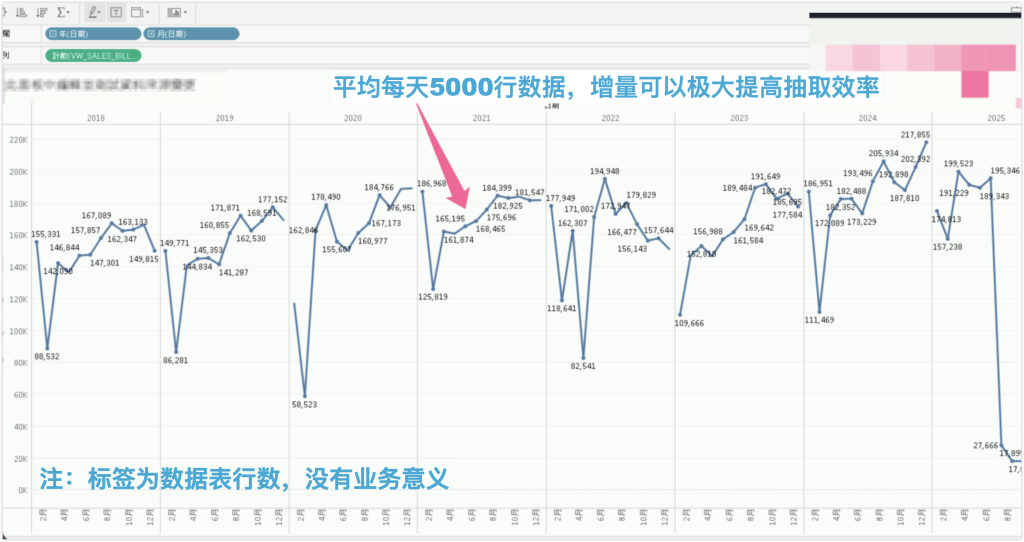
比如某个数据源,全量数据对应1500万行,覆盖很多年的数据,每次全量提取就要消耗很久时间。考虑到几年前的数据基本不可能变化,因此可以考虑增量提取的方式;由于近期数据微小调整可能累计影响准确性,可以通过周日全量提取校正。
这样,平时每天的提取就只需要不足一万行数据,
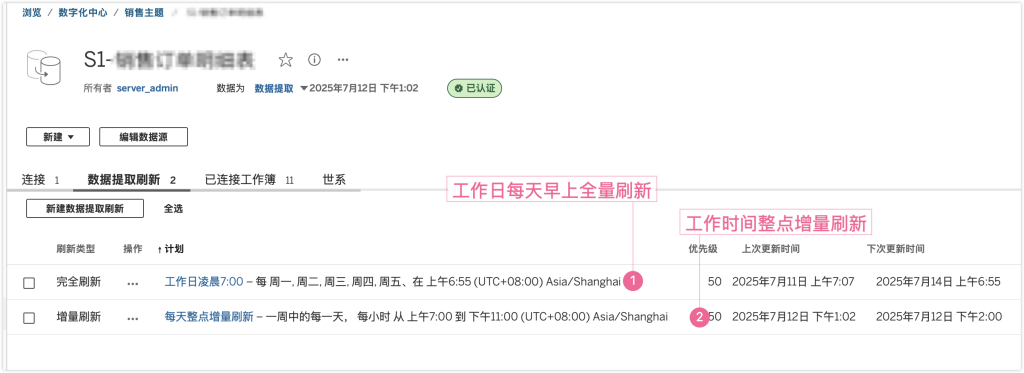
修改为增量提取之后,可以通过自定义的管理视图检查。如下图所示,点击上面的数据源,就可以看到完整的抽取(refresh extracts)和增量刷新(increment extracts)的计划情况了。在下面的数据中,周末全量抽取需要超过30分钟,而平时每天的增量刷新只需要2分钟即可。
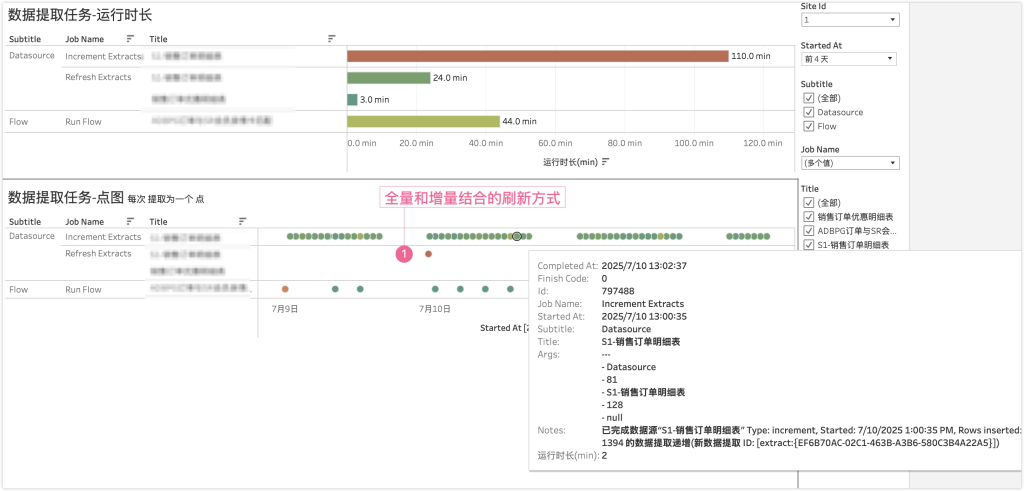
当然,如果是订单变化比较频繁的零售行业(很多订单存在隔日、隔几日的退货情况),订单量比制造业企业更多,那么也可以采用凌晨全量、整点增量的方式。比如,我为某家零售客户甚至了如下的计划:
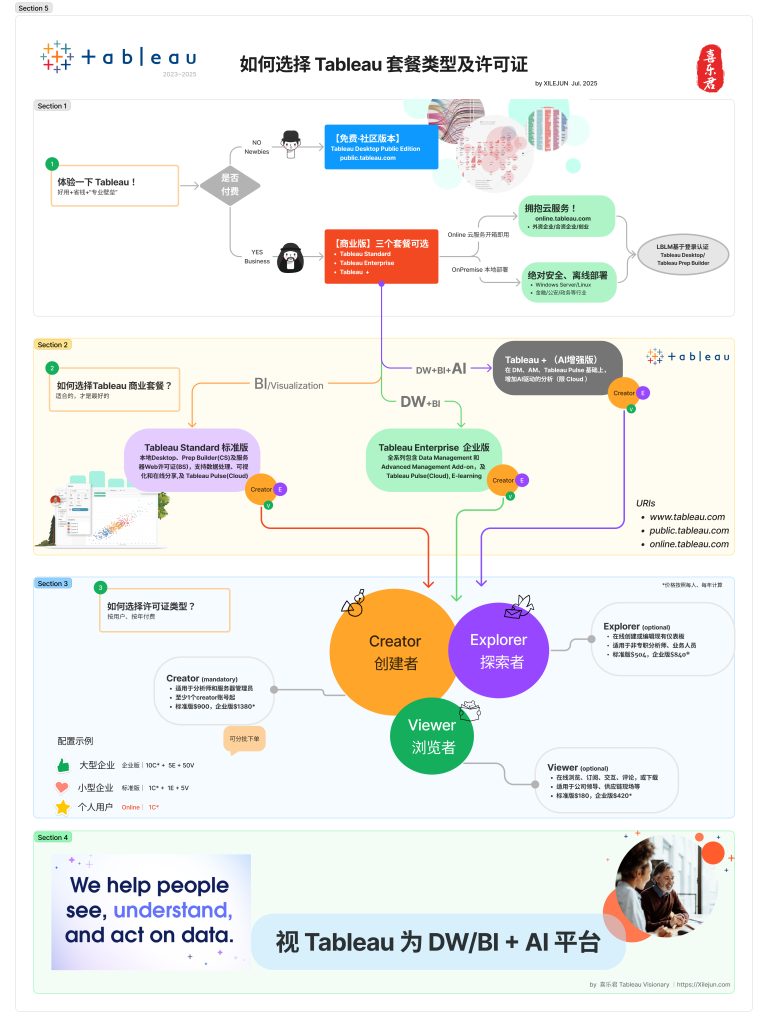
可见,优秀的 BI 已经可以完成很多传统数据仓库肩负的工作,从视图 view 到 etl 计划,从数据整理到数据管理;优秀的 Bi 正在模糊数据仓库和业务分析之间的壁垒。
Tableau Server 不仅仅是 BI,更是 DW/BI 一体化的平台,这才是真正的 BI 商务智能系统。
如有需要,欢迎前来咨询。
官方元数据参考: